macd

Trading is a thrilling activity that can lead to financial independence if done correctly. As a trader, the use of charts and indicators is essential in making informed decisions. One such indicator is the Moving Average Convergence Divergence (MACD) which is a popular tool among traders. In this article, we will dive into how you can use MACD to boost your trading strategy and achieve financial success.

MACD is a trend-following indicator that uses moving averages to identify changes in the trend direction. The indicator is made up of two lines, the MACD line and the signal line, both of which are derived from moving averages. The MACD line is calculated by subtracting the 26-period exponential moving average (EMA) from the 12-period EMA, while the signal line is a 9-period EMA of the MACD line.

One of the primary uses of MACD is to identify trend reversals. When the MACD line crosses above the signal line, it is a bullish signal indicating that the trend is likely to shift to an upward direction. On the other hand, when the MACD line crosses below the signal line, it is a bearish signal indicating that the trend is likely to shift to a downward direction.

Another use of MACD is to identify divergences. A bullish divergence occurs when the price makes a lower low, but the MACD makes a higher low. This indicates that the selling pressure is decreasing, and a reversal may be on the horizon. A bearish divergence, on the other hand, occurs when the price makes a higher high, but the MACD makes a lower high, indicating that the buying pressure is decreasing.

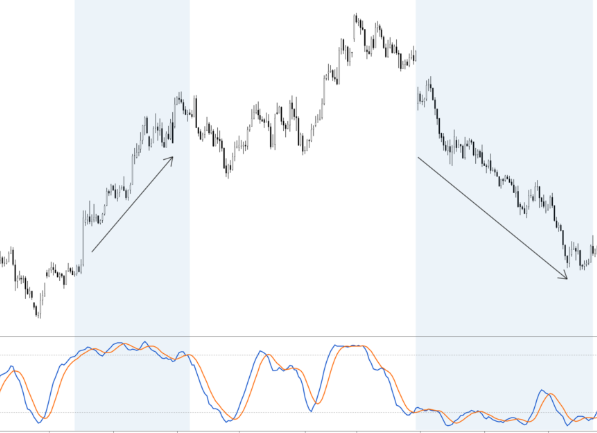
In addition to identifying trend reversals and divergences, MACD can also be used to confirm a trend. When the MACD line is above the signal line, and both are above the zero line, it indicates that the trend is bullish. Conversely, when the MACD line is below the signal line, and both are below the zero line, it indicates that the trend is bearish.

When using MACD, it is essential to remember that it is just one tool among many. It should be used in conjunction with other indicators and chart patterns to make informed trading decisions. It is also important to keep in mind that MACD is not infallible, and false signals can occur.

Recommended Posts

macd
Charts

Trading Charts with the MACD Indicator

Trading is a thrilling activity that can lead to financial independence if done correctly. As a trader, the use of charts and indicators is essential in making informed decisions. One such indicator is the Moving Average Convergence Divergence (MACD) which is a popular tool among traders. In this article, we will dive into how you can use MACD to boost your trading strategy and achieve financial success. MACD is a trend-following indicator that uses moving averages to identify changes in the trend direction. The indicator is made up of two lines, the MACD line and the signal line, both of which are derived from moving averages. The MACD line is calculated by subtracting the 26-period exponential moving average (EMA) from the 12-period EMA, while the signal line is a 9-period EMA of the MACD line. One of the primary uses of MACD is to identify trend reversals. When the MACD line crosses above the signal line, it is a bullish signal indicating that the trend is likely to shift to an upward direction. On the other hand, when the MACD […]

SwingTrader
Stocks

What Affects Stock Markets During the Earnings Season

During the earnings season, investors and stock market traders pay attention to many different variables that affect the stock market. This includes financial data and world issues. This article will cover these factors. Economic data Several major indicators, such as unemployment, GDP and GDP growth, can affect the stock markets. Although not every piece of economic data has a direct impact on the stock market, these indicators can trigger expectations of government action. One of the biggest economic indicators is GDP, which is the dollar value of all goods and services produced in a country during a particular time period. While a good GDP figure can boost share prices, a bad one can have the opposite effect. Another indicator is the Purchasing Managers Index. This is a measure of the growth of the manufacturing sector. A positive figure suggests that businesses are performing well and that their earnings are likely to increase. The housing and construction sector is considered an important part of any economy. The number of construction projects is another indicator of a healthy economy. High construction activity […]

SwingTrader