In the world of trading, the stochastic oscillator stands as a vital tool for assessing the momentum behind price movements. Momentum, essentially the rate of acceleration in price movement, forms the cornerstone of this indicator’s utility. The core idea underpinning the stochastic indicator revolves around the belief that an instrument’s price momentum often shifts before the actual direction of the instrument changes. Consequently, this indicator proves invaluable in predicting trend reversals with precision.
Utilizing the Stochastic Oscillator for Traders of All Levels
Whether you’re an experienced trader or someone new to the world of technical analysis, the stochastic oscillator can become a valuable asset in your trading toolkit. When coupled with other technical analysis tools like moving averages, trendlines, and support and resistance levels, the stochastic oscillator enhances trading accuracy and assists in identifying opportune entry and exit points.
The Stochastic Calculation Demystified
The calculation process of the stochastic indicator hinges on analyzing a price range over a specified time period or a series of price candles, with the typical settings involving a 14-period/price candle configuration. It compares the highest high and the lowest low observed over the last 14 candles to the current closing price. In its essence, it’s as straightforward as that.
Dispelling the Myths: Overbought vs. Oversold
One of the most prevalent misconceptions in trading relates to the notions of overbought and oversold conditions. Let’s delve into these expressions and unveil the truth that dispels the myth of overbought or oversold.
Contrary to popular belief, the stochastic indicator does not reveal overbought or oversold price levels. Instead, it provides insights into momentum.
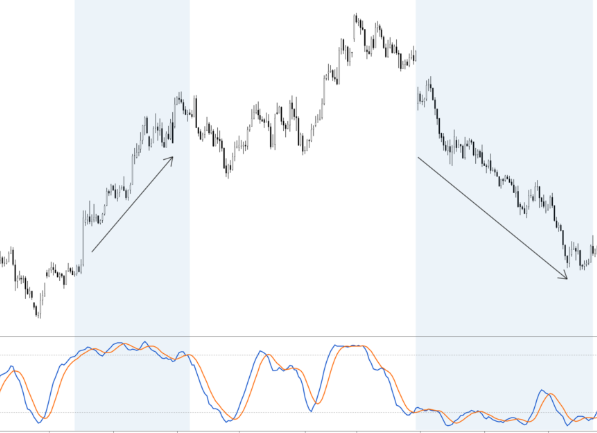
Traditionally, traders have been inclined to label a stochastic reading above 80 as indicative of overbought conditions and a reading below 20 as oversold. This is where the confusion arises. The reality is that an oversold market doesn’t necessarily foreshadow a decline, and vice versa. As previously discussed, when the stochastic indicator exceeds 80, it signifies a robust trend, not an imminent reversal. A high stochastic reading indicates that the price can consistently close near its high and continue ascending. Prolonged periods where the stochastic remains above 80 signal elevated momentum, rather than a bearish trend in the making.
Harnessing Stochastic Divergence Strategy
Another popular trading strategy harnessing the stochastic indicator is known as the divergence strategy. In this strategy, traders scrutinize an instrument’s price movements in relation to the stochastic indicator. They focus on instances where the price makes new highs or lows while the stochastic indicator doesn’t follow suit. This divergence can serve as an early warning signal of a potential trend reversal.
A bullish divergence occurs when an instrument’s price records a lower low, while the stochastic indicator touches a higher low. This suggests that selling pressure has diminished, potentially heralding an upward reversal. Conversely, a bearish divergence arises when the price establishes a higher high, while the stochastic indicator registers a lower high. This points to a slowdown in upward momentum, hinting at an impending downward reversal.
A Crucial Note on Divergence Strategy: Confirm Before Acting
It’s important to exercise caution when employing the divergence strategy. Trading decisions should not be hastily made solely on the basis of divergence. Instead, divergence should be confirmed by an actual reversal in the price. Prices can continue rising or falling for an extended period while divergence is occurring, underscoring the need for patience and vigilance in executing trades.
