If you’re new to the world of swing trading, you may be wondering, “What is swing trading?” Here’s a quick guide to what swing trading is. As its name implies, it involves trading stocks and options on a swing basis. Swing traders look at the chart of an asset to determine its entry point, set a stop-loss level, and anticipate when they want to exit. This allows them to maximize profits and minimize risks.
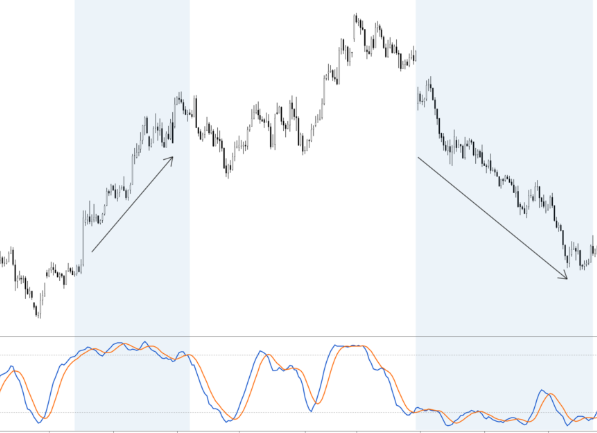
Price action is often a daily fluctuation, bouncing around a range or not getting too close to a specific value. The swing trader might believe that the stock’s price will be fluctuating daily, but a long-term hold will probably not yield much profit. In other words, if you’re able to pick a stock that will fluctuate every day, you’ll profit. The key to swing trading is learning how to interpret charts and use technical analysis tools to make smart decisions.
Technical analysis tools such as moving averages are essential for swing trading. Moving averages allow swing traders to use a moving average to smooth out price fluctuations. A 20-period moving average, for example, plots the average price over the past 20 days. Some swing traders use multiple moving averages, such as a five-period moving average and a thirteen-period one. The shorter the moving average, the faster it responds to prevailing prices.
Another common method of analyzing the market is technical analysis, or TA. Technical analysis is a way to identify potential opportunities and identify whether a trade is profitable or not. Swing trading is a great option for those who have a tight work schedule or who don’t want to risk the whole day on the stock market. In addition to providing more time for analysis than day trading, swing trading is a great introduction to the world of trading.

The primary difference between swing trading and day trading is the time frame. Swing traders typically look for opportunities that last for a few days or weeks. The actual time frame from one trade to the next is wildly variable. Traders can trade with a number of different assets. Using these tools, they can even trade in the cryptocurrencies market, which is gaining in popularity. But the biggest advantage of swing trading is that it doesn’t require a full time investment, making it ideal for people with daytime job commitments.
Another key difference between day and swing trading is the time frame. Day traders trade within one day, while swing traders hold positions overnight. Swing traders hold positions overnight, and their duration can range from a day to a week. Day traders, by contrast, may hold a position for a year or more. A swing trader holds their position over several days or weeks. And while day traders are more active, swing traders are usually passive.