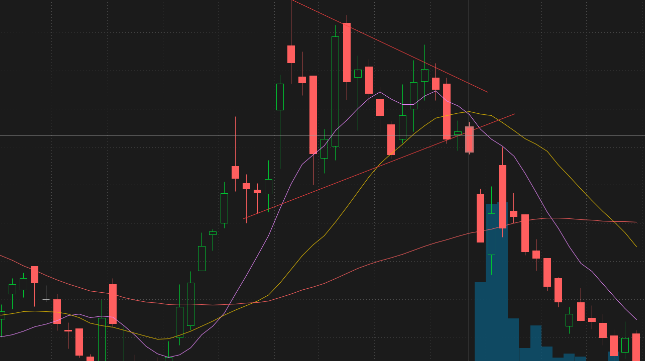
The chart for physical gold has been coiling for over a year now as you can see from the chart below and perhaps will start a move higher on any further easing from the Federal Reserve (which seems to be a strong possibility). If a move out of this coiling pattern does occur, you could play an ETF or if you are interested in buying physical gold, please read below for more information.
Investing in gold seems to be a more popular concept these days, and is now frequently mentioned as an alternative form of investment for those looking for opportunities outside of the ordinary stock market. The rise in popularity of gold bullion investment may be partially due to the convenience with which people can buy gold. These days, all you need to do is visit a relevant website, and you will find that you are able to buy, store and sell virtually any amount of gold bullion that you please. However, before you rush online to buy gold, it is a good idea to gain a better understanding of why people invest in gold, and whether or not now would be a good time to do so with regard to greater financial markets.
Gold bullion prices in general do not rise and fall with the same intensity or consistency as ordinary stocks, which means that people traditionally do not turn to gold when looking to make significant profits in investments. Rather, people tend to look into gold investments for the sake of financial stability, as gold can sometimes protect the value of your money more effectively than your own economy can. If you place money in gold, and then the value of your currency falls due to economic shifts, your value will have been protected in the form of gold bullion. However, this is not to say that the gold market is always a safe or smart alternative – just like any other sort of investment, it must be read with regard to specific times and trends.

For example, as of July of 2012, the price of gold seems to be levelling out a bit, after having performed quite strongly during the last few years of worldwide economic difficulty. Some would suggest that the increasing strength of the U.S. dollar and indications of an American economy that is slowly but surely stabilizing would make now a bad time to invest in gold. Generally, as the value of the dollar increases, the risk of investing in gold becomes less necessary, and more risky.
However, because gold bullion is not specifically tied to any one single economy, the somewhat positive trends in the United States should not entirely dictate the market for gold. In fact, with European financial markets now struggling mightily, many are still predicting the price of gold to continue rise in the near future, meaning it may still be a good time to purchase some gold. Ultimately, the decision of whether or not to invest depends on your own interpretation of financial patterns, and whether or not you trust in signs of general economic recovery.