trading

indicator
Charts

Indicators for Swing Trading – What’s Best?

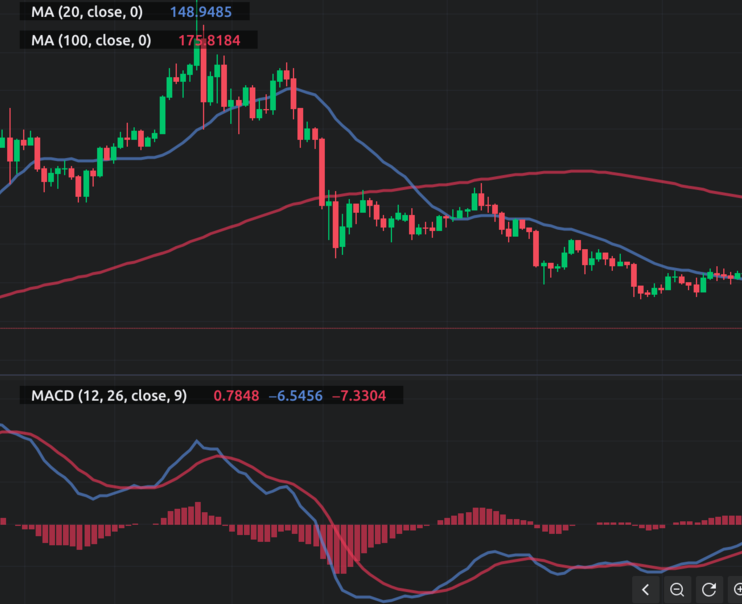
There are several indicators that you can use to make money swing trading. A moving average is a popular indicator, and is used to validate the direction of an asset’s price behavior over a specified period of time. The moving average can be created in two basic styles, simple and exponential. Simple moving averages are the easiest to use and provide the most recent statistics. The exponential version gives you more recent data and is best suited for shorter-term investment stocks. The Donchian Channel is probably the most common and straightforward indicator. It helps you identify buy lows and sell highs. Another tool that can help you find a profitable trade is the OHLC indicator. The Zig Zag indicator will help you find swing highs and lows, but it’s best used in conjunction with price action. While all three indicators are helpful, they won’t make your life easy. You must know how to interpret them properly. Another indicator for swing trading is the Relative Strength Index. This indicator is a trend indicator that shows when an asset is overbought or […]

SwingTrader
gold
Analysis

Gold Bullion Investment Strategy

The chart for physical gold has been coiling for over a year now as you can see from the chart below and perhaps will start a move higher on any further easing from the Federal Reserve (which seems to be a strong possibility). If a move out of this coiling pattern does occur, you could play an ETF or if you are interested in buying physical gold, please read below for more information. Investing in gold seems to be a more popular concept these days, and is now frequently mentioned as an alternative form of investment for those looking for opportunities outside of the ordinary stock market. The rise in popularity of gold bullion investment may be partially due to the convenience with which people can buy gold. These days, all you need to do is visit a relevant website, and you will find that you are able to buy, store and sell virtually any amount of gold bullion that you please. However, before you rush online to buy gold, it is a good idea to gain a better understanding […]

SwingTrader
swing-trading
Charts

So You Want To Swing Trade Stocks?

The first thing you should know about swing trading stocks is that you shouldn’t trade in the middle of the day. If you’re tempted to, you should know that you’re putting yourself at risk. Swing trading stocks are best when they’re at a high point in their uptrend and have a profit target of. You can also use candlesticks to determine trends and patterns and reduce your risk. You should also know how to follow the news in the market. The RSI (relative strength index) is a helpful indicator when swing trading stocks. This tool shows whether a particular security has reached a point of overbought or oversold. When a security crosses over the overbought zone, it is more likely to reverse into a downtrend than to rise again. Therefore, using RSI when swing trading stocks can be very effective. Traders can use this tool to find the best time to enter a position. Another helpful indicator for swing traders is the moving average. The moving average is a graph of the price of a stock over a given period […]

SwingTrader
bull stocks
Charts

Identifying Bullish Stocks – Chart Set Ups for Bulls

Identifying a bullish stock chart involves identifying its key characteristics. Stocks that have a rocket-like trajectory should be avoided because they rarely last longer than a couple of weeks and are inevitably followed by a sharp decline. Bullish stock charts generally show a consistent price trend from the lower left to upper right. Large advances will be peppered with consolidations that work off of extreme overbought conditions. Instead of a rocket, these charts look more like an upward mountain slope. Bull flags form when a stock reaches a high point, breaks through its lower low and then rises again. A bull flag occurs when the stock exceeds the highest high point, which forces shorts to cover and buyers to get off the fence. Once a bull flag forms, the stock starts to rise and forms an uptrend. Similarly, a bear flag is an indicator that a stock is headed for a downward trend. Candlesticks show a day’s worth of price data. Each candlestick shows an opening price, a closing price, a high and a low. The “body” of a candlestick […]

SwingTrader

Gold Stocks and When The Trend is Ripe for Trading

For years, gold stocks have been seen as safe havens, especially in uncertain times. By buying gold stocks, many investors have gained exposure to the coveted metal. Companies in this sector include Newmont Corp., Franco-Nevada Corp., and Newcrest Mining Ltd. Although gold prices have slowed considerably in recent years, many investors still believe that gold is undervalued. Many hold shares in companies. Barrick Gold is one of the world’s largest gold producers, with mine operations in both north and south America. With a market cap of $41 billion, Barrick Gold stocks have gained 20% year-to-date. The company has a track record, delivering production in line with guidance for the last three years. Despite challenges including the COVID-19 law and inflation, Barrick has managed to maintain its operating performance. In addition to mining gold, the company also maintains an extensive exploration portfolio. Investing in gold stocks requires careful analysis. It’s important to evaluate each company’s financial performance. Does the company pay dividends? Does it have high cash costs? Do they offer attractive dividend yields? Do their balance sheets reflect the health […]

SwingTrader

Charts for Index Trading – The Tool For The Pro’s

A stock index chart is an important tool in a trader’s arsenal. This visual display of historical trends of the US market indexes provides a clear picture of where prices are headed. The charts are updated each Friday evening and are available to members. PRO members have access to complete versions of these charts. Non-PRO members can view data from 1980 until today. Traders can also view historical trendlines to identify support and resistance. The Dow Jones Industrial Average closed below the rising 50-day EMA and has since dropped to a test of the 200-day EMA. It has not reclaimed this support, however, because bearish daily technical indicators are signaling that the support level is not going to hold. The MACD has crossed above its signal line, but remains in negative territory. The RSI has also failed to cross its 50-day EMA and is headed downward. Similarly, slow stochastic has crossed its 50% level into bullish territory, and a break of this resistance level is a good sign of further decline in the index. The DJIA represents nearly one-fourth of […]

SwingTrader

Hard To Argue About the Strength of This Market

After a massive run-up going into this morning’s job number, the market was certainly set up for a selloff, and when the number came out (which was AWFUL), we certainly got a selloff…sort of. The market started the day with a gap, tried to bounce a bit, but then quickly sold off further. That was about it, however, and around 11:15, a bottom was put in for the day and the market rallied strongly from there, finishing well off of its lows. Although the final numbers will show decent sized losses, in my opinion today was a very impressive showing by the bulls. Remember as well that this was in the face of an AWFUL jobs number… I went into the day short two stocks (SOHU and BEXP) and long only one stock. I was stopped out of both shorts by lunchtime and began to go long again in force as I saw setups I liked all over the place. This may be the wrong play as perhaps the market needs to pullback further from here, but given the action […]

SwingTrader