charts

chart
Analysis

When Stocks Suck – It’s Time to Run Your Analysis

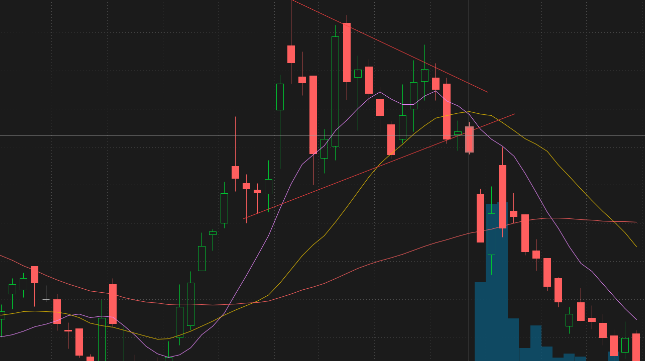
There were quite a few bullish chart setups on individual stocks. After pulling back to the 50 day moving averages, stocks bounced hard two Fridays ago and the S&P and Nasdaq looked like they were done with a slight, normal pullback. So what did we get this past week??? You guessed it. In hindsight, I should have known the ball was going to pulled out again by this market. That is what it is best at right now – tricking and confusing all traders, bulls and bears alike. It has done it so many times now that we should all be expecting it. Trading it however is a lot easier said than done because what we see with our eyes is certainly telling us one thing, whereas the market seems to just keep throwing curveballs at us that our eyes can’t judge correctly. To be perfectly honest, this market sucks but there is nothing we can do about it except accept it and try to not let it affect our returns too much in a negative way. That’s easier said […]

SwingTrader
bull stocks
Charts

Identifying Bullish Stocks – Chart Set Ups for Bulls

Identifying a bullish stock chart involves identifying its key characteristics. Stocks that have a rocket-like trajectory should be avoided because they rarely last longer than a couple of weeks and are inevitably followed by a sharp decline. Bullish stock charts generally show a consistent price trend from the lower left to upper right. Large advances will be peppered with consolidations that work off of extreme overbought conditions. Instead of a rocket, these charts look more like an upward mountain slope. Bull flags form when a stock reaches a high point, breaks through its lower low and then rises again. A bull flag occurs when the stock exceeds the highest high point, which forces shorts to cover and buyers to get off the fence. Once a bull flag forms, the stock starts to rise and forms an uptrend. Similarly, a bear flag is an indicator that a stock is headed for a downward trend. Candlesticks show a day’s worth of price data. Each candlestick shows an opening price, a closing price, a high and a low. The “body” of a candlestick […]

SwingTrader

Gold Stocks and When The Trend is Ripe for Trading

For years, gold stocks have been seen as safe havens, especially in uncertain times. By buying gold stocks, many investors have gained exposure to the coveted metal. Companies in this sector include Newmont Corp., Franco-Nevada Corp., and Newcrest Mining Ltd. Although gold prices have slowed considerably in recent years, many investors still believe that gold is undervalued. Many hold shares in companies. Barrick Gold is one of the world’s largest gold producers, with mine operations in both north and south America. With a market cap of $41 billion, Barrick Gold stocks have gained 20% year-to-date. The company has a track record, delivering production in line with guidance for the last three years. Despite challenges including the COVID-19 law and inflation, Barrick has managed to maintain its operating performance. In addition to mining gold, the company also maintains an extensive exploration portfolio. Investing in gold stocks requires careful analysis. It’s important to evaluate each company’s financial performance. Does the company pay dividends? Does it have high cash costs? Do they offer attractive dividend yields? Do their balance sheets reflect the health […]

SwingTrader

Charts for Index Trading – The Tool For The Pro’s

A stock index chart is an important tool in a trader’s arsenal. This visual display of historical trends of the US market indexes provides a clear picture of where prices are headed. The charts are updated each Friday evening and are available to members. PRO members have access to complete versions of these charts. Non-PRO members can view data from 1980 until today. Traders can also view historical trendlines to identify support and resistance. The Dow Jones Industrial Average closed below the rising 50-day EMA and has since dropped to a test of the 200-day EMA. It has not reclaimed this support, however, because bearish daily technical indicators are signaling that the support level is not going to hold. The MACD has crossed above its signal line, but remains in negative territory. The RSI has also failed to cross its 50-day EMA and is headed downward. Similarly, slow stochastic has crossed its 50% level into bullish territory, and a break of this resistance level is a good sign of further decline in the index. The DJIA represents nearly one-fourth of […]

SwingTrader