There were quite a few bullish chart setups on individual stocks. After pulling back to the 50 day moving averages, stocks bounced hard two Fridays ago and the S&P and Nasdaq looked like they were done with a slight, normal pullback. So what did we get this past week???
You guessed it. In hindsight, I should have known the ball was going to pulled out again by this market. That is what it is best at right now – tricking and confusing all traders, bulls and bears alike. It has done it so many times now that we should all be expecting it. Trading it however is a lot easier said than done because what we see with our eyes is certainly telling us one thing, whereas the market seems to just keep throwing curveballs at us that our eyes can’t judge correctly.
To be perfectly honest, this market sucks but there is nothing we can do about it except accept it and try to not let it affect our returns too much in a negative way. That’s easier said than done, which is one reason I really didn’t follow the market at all the past three days. I thought it was better to just step away as I didn’t see any edge at all. After doing my scans today and looking at a bunch of charts, things do look pretty clear (just like they did last week.)
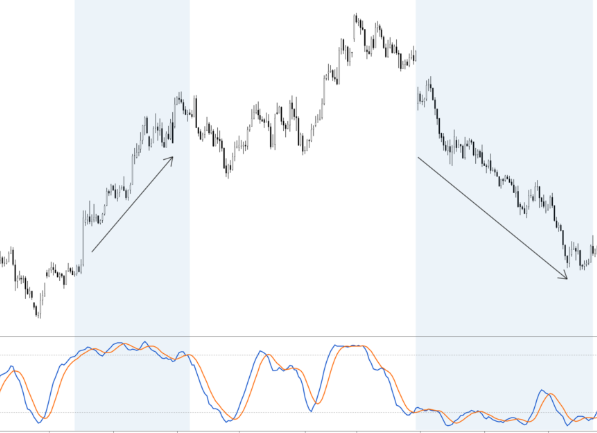
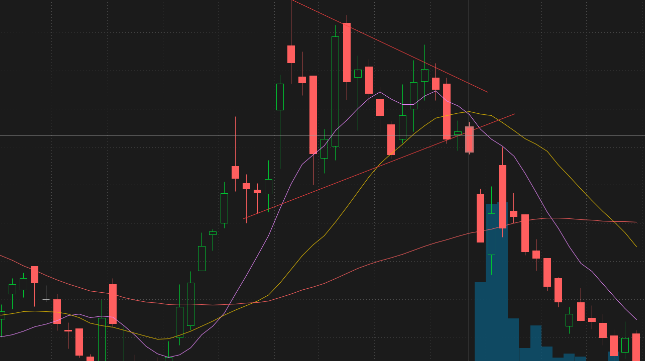
If you look at the S&P and Nasdaq above, you see a LOT of bearish action. We had the 50 day MA broken to the downside on both indices this week. The past two days have produced a weak bounce back into the short-term moving averages (9 and 20 day EMA). If you look very closely, you’ll notice that although there were gains both Thursday and Friday, there was also possible distribution under the surface as both days the market finished near its lows for the session and well off of its highs. What we have now are the beginnings of what look like textbook bear flags.
Normally, I would get my list of short setups ready and share them here. After the past few months, however, I am officially saying “screw it” and going the other way. I hate to use the word “think” to describe what may happen this week because there isn’t much logic to it, but a rally seems to be in the cards based on how stupid this market has acted the past few weeks/months. Every time we’ve seen this situation (a big breakdown followed by a very weak bounce forming bear flags), the market has then had a big up day and proceeded to grind its way higher from there for a few more days, screwing over the bears. I can see the same thing happening this week. The bulls got screwed early this past week – isn’t it the bears turn?
If we get above Friday’s highs on the Nasdaq, I may put a buy order in on some ETFs and see what happens. Here are some names that came up in my scans today that could rally a bit if the market decides to fool everyone again.
It is going to be a thin week volume-wise with the holiday coming up but traditionally these are bullish weeks on Wall Street. Who knows though? This is as unpredictable a market that I can remember (although my memory only goes back six or so years). I will either be in cash this week or some small long positions to see if the “do the opposite of what seems obvious” really will work. This outlook makes no sense, but neither does this market.